
Meet the equation That can explain Your Revenue Problem
Stop guessing whether it's creative, media, or something else entirely.

Performance is suffering. Sales are down. You're spending more on ads just to prop up the same results, and you've tried everything in the playbook. Sound familiar? These are the problems we help clients solve every day — and more often than not, the fix starts with a simple equation, not a bigger budget.
Before you launch another round of creative or shift more dollars into media, it's worth asking a more basic question: where, exactly, is the breakdown happening?
Understanding The Equation
Revenue isn't one number you can troubleshoot directly. It's the end result of a chain of smaller metrics, each one narrowing the pool before it:
Ad Spend → Clicks → Visits → Orders → Revenue
Written out as an equation, it looks like this:
(Ad Spend ÷ CPC) × Click-to-Visit Rate × Conversion Rate × AOV = Revenue
There's a lot of nuance buried inside each of these metrics, but we won't get into that today. At a high level, this equation does something valuable: it tells you whether you have a media problem, a conversion problem, or a cart size problem — instead of leaving you to guess.
Breaking it down
Say you're putting $1,000 into ad spend at a $1 CPC. That gets you 1,000 clicks. Not every click turns into a visit, so applying a 75% click-to-visit rate leaves you with 750 users actually landing on the site.
Not every visitor converts, either. At a 2% conversion rate, those 750 visits turn into 15 orders. With a $100 average order value, that's $1,500 in revenue.
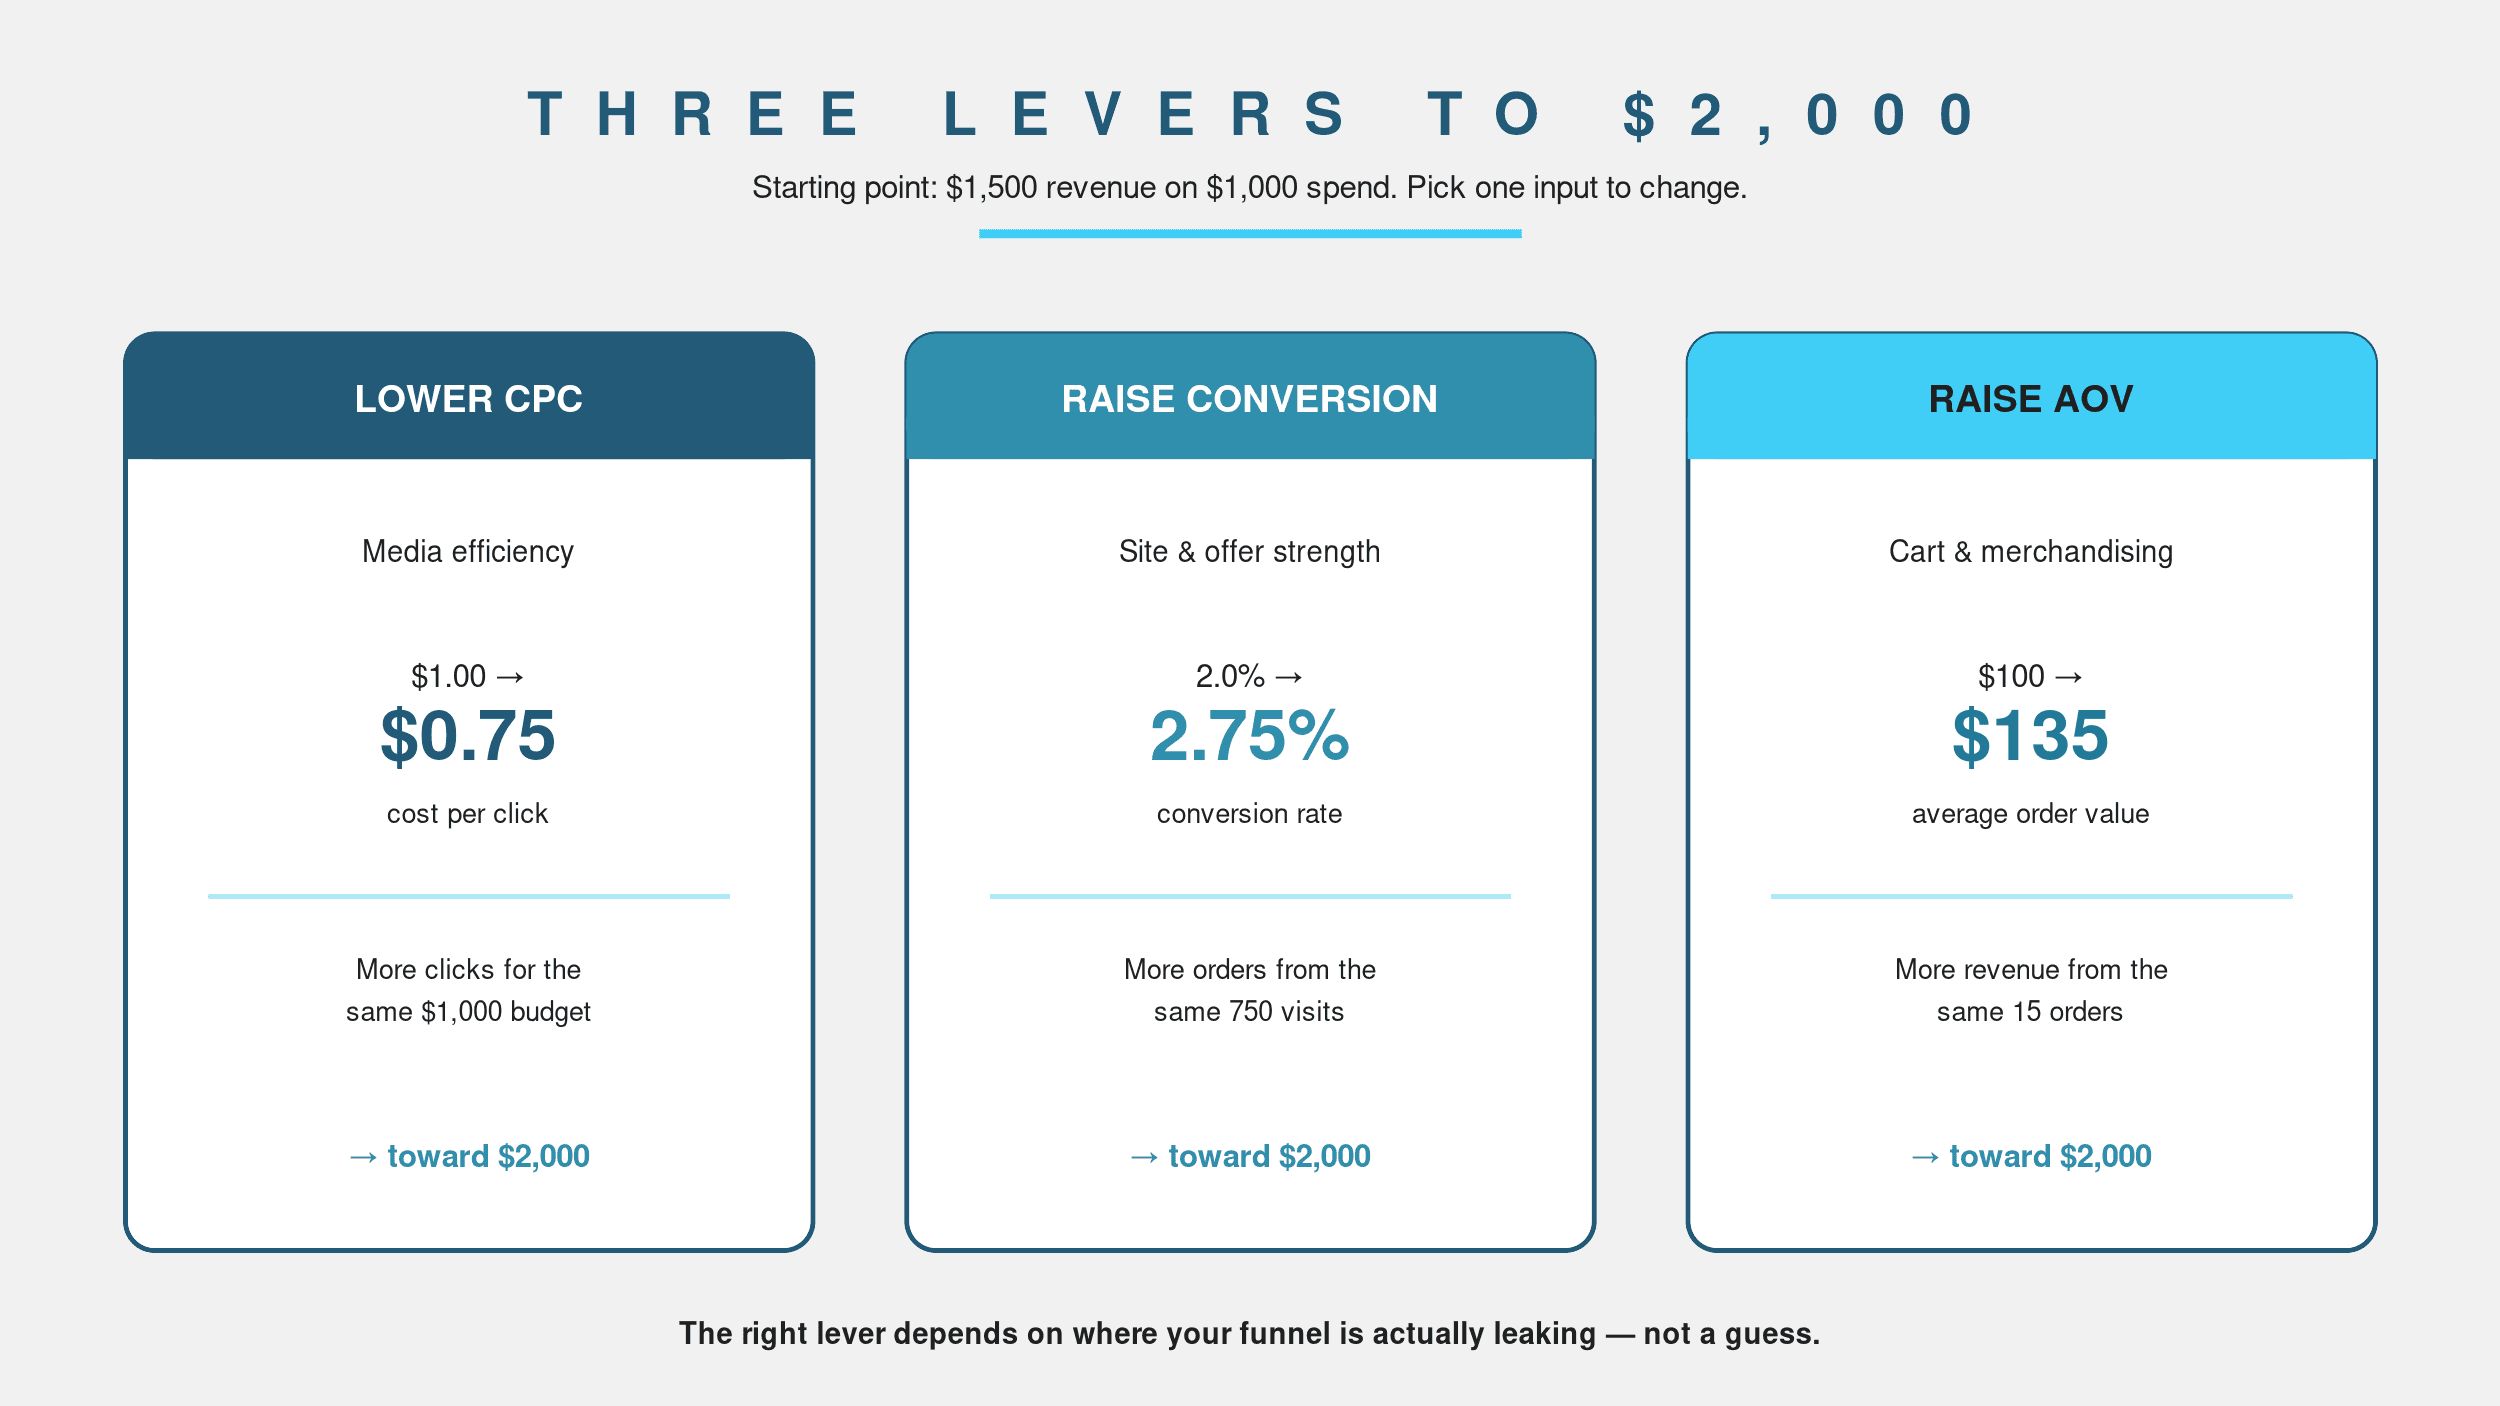
Now, say the goal is $2,000. Changing any single input in the equation changes the outcome — and there's more than one lever available to get there:
— Drive a more efficient CPC. Lowering the cost-per-click by just $0.25 puts more clicks behind the same budget, bringing more visitors – and potential customers – to the site.
— Improve conversion rate. Lifting it from 2% up toward 2.75% moves the needle without spending another dollar on media.
— aise AOV. Nudging average order value up toward $135 gets you to your topline goal through the cart, not the funnel.
None of these levers is automatically the "right" one. That's exactly why the equation is useful: it turns a vague problem ("sales are down") into a specific, testable one ("is this a media problem, a conversion problem, or a cart size problem?").
Prioritizing with relevant context
Knowing which lever to pull is a lot easier with benchmarks. This is where a team like Strategy Labs earns its keep — we work across dozens of clients and a wide book of business, which means we can tell a brand exactly where they're falling short relative to their category, not just relative to their own history.
That context turns the equation from a helpful exercise into a genuine prioritization tool: instead of splitting attention evenly across media, creative, and CRO, you spend your time where it will move revenue the most.
The Bottom Line
Revenue problems feel enormous until you break them down. Once ad spend, CPC, click-to-visit rate, conversion rate, and AOV are laid out as one equation, "sales are down" stops being a mystery and starts being a math problem — one with a clear starting point.